Archive | Cycling RSS feed for this section

New benchmark!

15 Jan

10000

Just before the end of 2015, on December 28 in fact, I reached a new benchmark and the goal I was aiming to achieve by the end of the year: 10,000 km ridden on my FES bike in 3 1/2 years (4200 km in 2015 alone).  that’s a lot of distance covered by a pair of paralyzed legs! If you are able-bodied, how far did you cycle last year?

Here is a copy of the summary page of the online log of all of my rides, as recorded by the bike manufacturer. In addition to the total distance ridden so far (6329 miles as of January 15, 2016 = 10,185 km), you can also see the distance I covered in each session (in red, and by others with my same physical condition in blue), and the average power output during each session. I appear to be working much harder than others in my situation. I have no explanation for this other than that I love cycling!

160115-summary

I also manually log all of my rides on Strava, and you can see my profile and stats there.


Good versus not so good

15 Jan

My workout warm-ups are important, and not just for the role they play in getting the muscles moving. I do pretty much the same routine all the time, only occasionally making slight changes to my workout. By sticking to one standard, I can look at my performance during the warm-up and use it to tell me whether I should go easy or hard during the rest of the workout. If I am weak during the warm-up, perhaps it will be a good day to just take it easy. On the other hand, if my muscles are performing better during the warm-up, this might suggest that I have the energy to try harder workout.

Below, are the results from two of my workouts. You can see how the resistance (and also the RPM) increase over a number of steps during my 20 minute warm-up session. During my good warm-up, in the first graph, you can see that the average power on the hardest step of the warm-up was 26 W. In the not so good warm-up, in the second graph, the average power on the top step is only 19 W.

151208w151225w

I swear I lived

6 Jun

well, this pretty much says it all…

But until my moment comes, I’ll say…
I, I did it all
I, I did it all
I owned every second that this world could give
I saw so many places, the things that I did
With every broken bone, I swear I lived.

Never give up

8 Apr

Here’s the story of a woman in the Netherlands, Funda Müjde, whose father immigrated there 50 years ago. On a trip back to Turkey for a vacation, her taxi was struck by a 19-year-old car driver, and she became a paraplegic. It took a while, but eventually she got her mojo back. Her motto? Never give up!

One of the things that helped her regain her physical strength as well as her mental strength and attitude was the act of getting back on the bike – very special bike called a Berkel Bike, which moves by arm power, and optionally by leg power as well. Even if you can’t move your legs, the bike will move them for you. In addition, you can add functional electric stimulation, FES, and then generate power with your legs even if you are completely paralyzed. Funda got the idea to ride from the Netherlands back to Turkey to celebrate the first immigration from that country. Here is a story about her plan to make that journey:

And lastly, here is a short video about her triumphant arrival in Istanbul after completing the 4000 km ride. It’s in Turkish, but the images are compelling.

2014 year in review: exercise

1 Jan

141231-review


2014 was a good year for me, exercise wise, as logged in my training calendar on Strava. Thanks to my FES bike, I was able to cycle around 3600 km in spite of being a high level quadriplegic. I rode 200 times during the year, mostly exercising my legs, though I also exercised my arms once a week for most of the year.  That’s an average of 70 km per week, every week of the year.

How did you fare with your own physical activity program last year?

( Since I don’t have any hand function, here’s a big shout out to my fiancée Julie, my daughter Ceara, my son Andrew, and the therapists at Spinal Injury Alberta, without whose assistance none of this would have been possible. Thank you, thank you, thank you!)

Video

My thoughts on FES

23 Nov

Improved warm-up results

21 Nov

Previously during my warm-up routine, I had been exercising with the stimulation frequency around 40 Hz, and a pulse width of around 300 µs. Now I have made a change, and increased the pulse width to 500 µs. Immediately I noticed an improvement in the warm-up results: at each level of increased resistance, the stimulation required is lower. A couple of times I have been able to go all the way up to a resistance of 5 Nm before the stimulation hits 100%. Why is this? A higher pulse width causes stimulation to reach more muscle fibers. Something to consider for those of you that are riding FES bikes.

141120w

Video

Martyn Ashton trying to adapt

31 Oct

Martyn Ashton was one of the world’s leading trials bike riders, and the person who created the outstanding films: road bike party one, and rode bike party two  (see links below).


last year he suffered a horrible accident and is now paraplegic. This is a story of how he is learning to adapt:

http://www.animal.co.uk/2014/10/martyn-ashton-year-one/

I find it interesting that even though he was injured on a bicycle, his mind is focused on somehow, someday getting back on a bicycle, because that is who he is and what he wants to do in life.


Assessing fatigue

9 Jun

You may well ask, if I can’t feel my legs, how can I tell whether the exercise I am doing on my FES bike is overdoing it or not? Good question. I use a couple measures to help me determine I level of fatigue:

  1.  if the level of stimulation goes up to 100%, and then the automatically controlled resistance begins to reduce and reduce and reduce, that’s a sure sign that my legs are getting tired.
  2. When I am doing an intense interval with manual control of resistance, then the machine will not reduce my resistance even if my legs are getting tired (though the RPMs will fall). In this case, I can look at the average power per lap during the session and see whether it was falling towards the end. Also, I can monitor my power output during the exercise and see whether it is stable or decreasing.
  3. In addition, when I do more than one session of the same type I can monitor whether my power output was higher in the second session than the first, or whether it is beginning to decline with each succeeding session. A variation of this, when I am doing an easy session, is to see whether the level of stimulation required increases in each successive easy session.
  4. Lastly, though I can’t feel the skin on my legs, it seems that after an intense workout my brain can sense that the legs are tired. There’s a heaviness that I don’t sense prior to my workout. This is fascinating, because my injury is considered complete, which means my brain receives no sensation from nerves below the entry level. How is it possible then that I can sense fatigue?
  5. Related to this, if I had a really hard workout, afterward I find that I cannot stand in my chair for very long without my consciousness fading away. When I am fresh, I can stand much longer.
  6.  If I have pushed too hard during a workout, when I stop, my blood pressure may fall precipitously and I will bonk seriously. If I have trouble remaining consciousness after a workout, that’s a sure sign that I have overdone it.
  7.  And finally, if I do two identical workouts several days apart and experience much worse results on the second workout, that’s a sign that I am either fatigued, or coming down with a cold, or something similar. It’s a clear indication that I should take it easy for the next couple of workouts.


There are a few graphs from today’s workout illustrate my points.


140609-Int2


In the graph above, the black line shows average power per lap during this session. Average power was higher in the second left in the first as my legs got used to the level of work required, and was only 10% less in the third lap. After a 15 minute break, the average power during the last lap was nearly as high as in the second lap. Conclusion: in this session, fatigue is not an issue.


Well now, let’s look at the two easy sessions I did during this workout. In the first, below, the stimulation level (blue line) rose to nearly 100% and then stayed fairly constant around 95%. In the second easy session, further below, the stimulation level only rose to around the 80% level, indicating that my legs were not worn out yet. However after two hours of riding, I was ready to take a break!


LSD (long slow distance) session 1:

140609-LSD1


LSD (long slow distance) session 2:

140609-LSD2


Any questions?

Best workout yet

8 Jun

Well, if I keep riding an FES bike, I might have to reuse the title of this post a few more times in the future. but still, I did enjoy a great ride on Saturday this week.   I have learned that I enjoy my rides more, and often get better results, if I mix it up a bit and don’t simply do the same thing for my entire workout. So in this latest workout, I actually logged four different sessions in succession. First, I did a 20 minute warm-up where I gradually increased both stimulation level and RPM, so my muscles could slowly get warmed up and get used to the stimulation level. Then, I moved on to interval training to work at a high, intense, level. After half an hour of that, I dialled it back and took it easy with some LSD [long slow distance], where I tried to recover my energy with some nice easy pedaling. Finally, one last blast with the interval training, which is where I achieved a new record energy output.  More on that below.


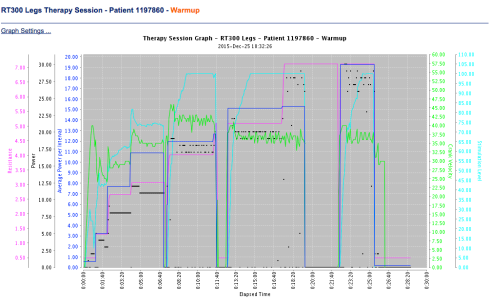
Here’s how the warm-up looked: 140607-warmup


My idea for the warm-up, as outlined in a previous post, is to slowly increase both speed (green line) and resistance (magenta line) so that that the stimulation level (light blue line) gradually increases up to a maximum of 100% at or near the end of the 20 minute warm-up.  On this day, I hit the 100% level after 18 minutes, and the machine did not substantially reduce the resistance during the last two minutes of the workout. My average power (black line) during the last step of the warm-up was around 20 W, while maximum power (black dots) was around 22 W.  Warmed up muscles: Mission accomplished!


After one intense interval session, as I mentioned earlier, I took it easy for a while. Here is what that easy interval looked like:


140607-LSD


At first, I had the resistance sent too high, so the machine rapidly increased the stimulation level to 100% and then had to begin reducing the resistance so that my legs could keep up. In the second lap, I got smarter and reduced the resistance. Then the machine slowly increased the resistance level but it never got to 100%. As you can see the average power output was higher in the second lap than in the first lap.   Now I was ready for one last intense session. Here’s what that last workout session looked like:   140607-ride


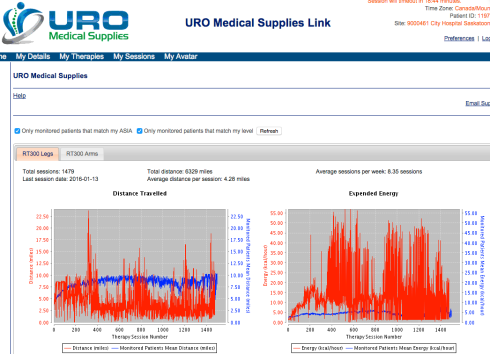
I did four laps, each one at the maximum resistance of 20.75 Nm and the maximum speed of 55 RPM, followed by 30 seconds of taking it easy. Each successive lap, my average power output increased, with the last one being at 77 W. My overall energy output during this session was over 55 KCalories per hour. That is equivalent to an average of 64 W over the 20 minute period.   After my nearly 2-hour workout, I was both happy and tired, and ready for a nice cold beer!   Final word: as always, I owe a huge debt of thanks to my fiancée Julie, without whose assistance none of this would be possible.